[vc_row][vc_column width=”1/1″][vc_column_text]
Now that CMS Made Medicare Physician Payment Data Available Online, How Will It Be Used?
The database, known as the Carrier Standard Analytic File, contains information on physicians and other health care providers participating in Medicare who are paid on a fee-for-service basis. It incorporates all physician, ambulance, ASC, DME, physical therapy and other Medicare Part B claims that Medicare paid directly by CMS under Traditional Medicare.
“It cannot contain Medicare Advantage Claims data becaus that data is protected under seal of a contract, which has a confidentiality clause in it. Once CMS paid the MA plan, that money is out of their purview.” says managed care expert Maria Todd
About the Data
The newly released data includes information on payments made under Medicare Part B in 2012 to all providers who participated.
Specifically, the data includes:
- Physicians’ names and addresses;
- Summaries of the services provided; and
- The amount providers were paid for the services.
From that data, many calculations and models can be created.[/vc_column_text][vc_column_text]Yesterday, I spent time with our research analysts to pore over the raw data included in the Medicare Physician Payment Data that was released by CMS on Wednesday evening. Lots of “Click bait”1 stories were published stating doctors are working for $57 a visit, for example. It was easy to see how they came to that false logic. Many others cited the ophthalmology drug costs skewed the data, well, yes – for ophthalmology, but not for orthopedics, for example. (Their sweet spot was something else.)
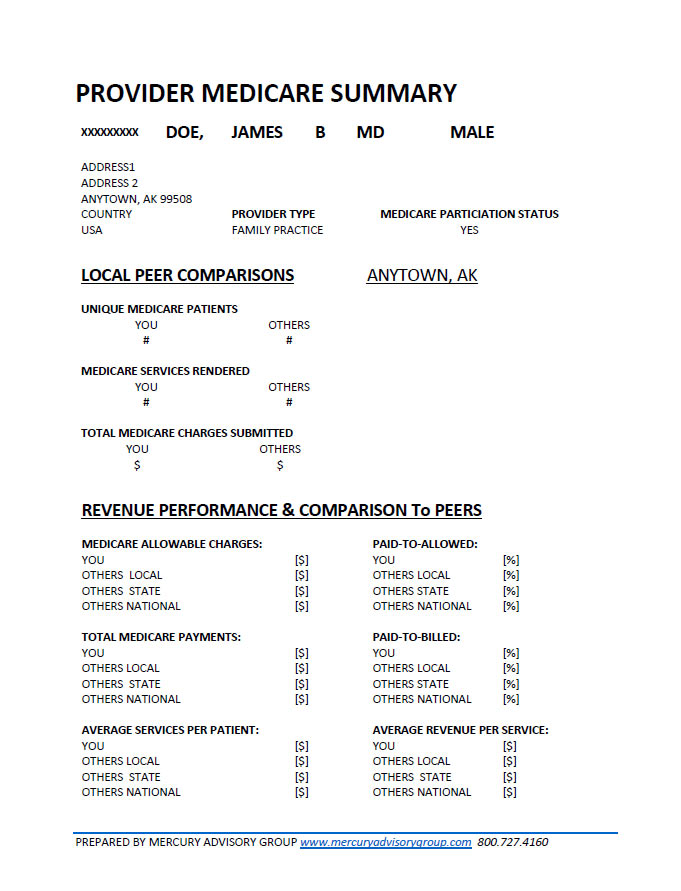
As a courtesy to our clients, we developed a report (below) derived from the data supplied by Medicare. Our programmers built a proprietary application that takes the data and processes it using certain formulas to produce the peer comparison. Why is it important to look at the data this way?
- First, because other payers will look at it to determine if providers are outside the acceptable curve in utilization, not seeing patients enough to maintain engagement in good health and prevention, etc.
- Second, because they will use the data to benchmark their own payment offers and negotiated fee schedules. They can see exactly where the sweet spot is for each provider. This is precisely why the Medicare Advantage data is not there, because the MA payments are negotiated under protection of a confidentiality term in a contract. So once CMS pays the MA plan, that money is out of their direct care and control.
If you are an existing client, you will automatically receive this via email. If you have not received your report, feel free to drop us a line using the form below. You will not be charged. If you are not an existing client, but would like to have a personalized report, you may order one or more for your practice, your group, or extras to perform market comparisons with other markets. This is especially helpful if you plan to relocate your practice or are considering concierge medicine transition and need to make market comparisons or an economic and health access impact analysis if you elect to leave the Medicare Program.[/vc_column_text][vc_divider show_line=”yes”][/vc_column][/vc_row][vc_row][vc_column width=”1/4″][vc_column_text] [/vc_column_text][/vc_column][vc_column width=”3/4″][vc_column_text]
[/vc_column_text][/vc_column][/vc_row][vc_row][vc_column width=”1/1″][vc_divider show_line=”yes”][/vc_column][/vc_row][vc_row][vc_column width=”1/4″][vc_column_text]
Would you like a personalized profile and comparative market analysis for your practice?
Our analysts can prepare a report similar to the one seen above. For the local data peer comparisons, and market assessment, we will include your zip code and 4 others of your choosing.
The cost is $9.95 per physician.
Turnaround time is 1 work day. To order your report, send us an email with your NPI number, and the 4 zip codes you would like for comparison. We will invoice you and upon completion of your transaction, you will receive your report via email. If you would like additional physician reports, or additional zip code comparisons, you can order additional reports and just specify the other zip codes.[/vc_column_text][/vc_column][vc_column width=”3/4″][contact-form-7 404 "Not Found"][/vc_column][/vc_row]

I would expect that oncology, interventional pain management, neurology, cardiology, rheumatology, will all begin to consider leaving Medicare as the Mayo Clinic has done, and consider more heavily their options in Concierge Medicine. This in addition to a significant number of primary care physicians.
With an average Medicare visit frequency of 12.5-15 visits PTMPY, many physicians may also rethink their strategy for how often they recommend return office visits to the Medicare patients to attempt to get them to engage in their health and preventive treatment plans, which will add about $410-$513 to their annual revenue per patient. What we saw when we analyzed the data was that many PCPs really only see Medicare patients ~3x per year. If the physicians increase the visit frequency by $400-$500 but can yield better engagement and an ROI of >1.0, the increased expenditure is still a win. The challenge is, will they have the time, space, and staff to fit that many more visits in (~9 per senior, per year)?
The economic impact of this increased utilization would also be more staff, more jobs, and more employment in communities, more spending power, by the nurses, Medical Assistants, techs, and so on.
Perhaps by increasing Medicare visit frequency, the physicians would be able to make an impact to improve medical literacy levels, by having more time to teach seniors about aging, how their bodies work, why their sugar and cholesterol and hypertension “happens”, and engage seniors in taking better care of themselves through better nutrition, exercise, and other steps to reduce COPD, CHF, CVA, osteoarthritis and depression.